Dashboard Management
The dashboard is the first thing you see when you log into the Pluto Systems sales app. It gives you a real-time snapshot of what matters most — upcoming closings, pending signatures, active reservations, and more — all organized into individual panels. This guide covers how to personalize your dashboard layout, apply filters, and understand how your role and permissions determine which panels are available to you.
How We Got Here
After logging into the sales app, the dashboard loads automatically as your home screen. The panels you see are determined by your assigned User Role and individual Permissions. From here, you can customize the layout, reorder panels, adjust display settings, and apply filters — all of which are remembered the next time you return.
Roles & Permissions Shape Your Dashboard
Not every user sees the same dashboard. The panels available to you are directly determined by your role and permissions. This ensures that each staff member only sees the information relevant to their responsibilities.
- Admin, Senior Management, and Pluto Admin roles see all available panel types.
- Salesperson and Sales Manager roles see a base set of panels (such as Upcoming Closings, Upcoming Subjects, and Recent Status Changes), plus additional panels tied to their specific permissions.
- The SalesStandardWorkflow permission unlocks reservation, identity verification, deposit, and signing panels.
- The Approve Realtor Registration permission adds the Pending Realtor Registrations panel.
- Any Options-related permission adds the Pending Late Options and Pending Custom Options panels.
If you don't see a panel you expect, it's likely because your account doesn't have the required permission. Contact your Admin to have it granted. For a full breakdown of roles and permissions, see the Creating & Managing Staff guide.
The View Other Staff Dashboards permission allows you to filter the dashboard by other staff members. Without it, you will only see data related to your own activity.
Personalizing Your Dashboard
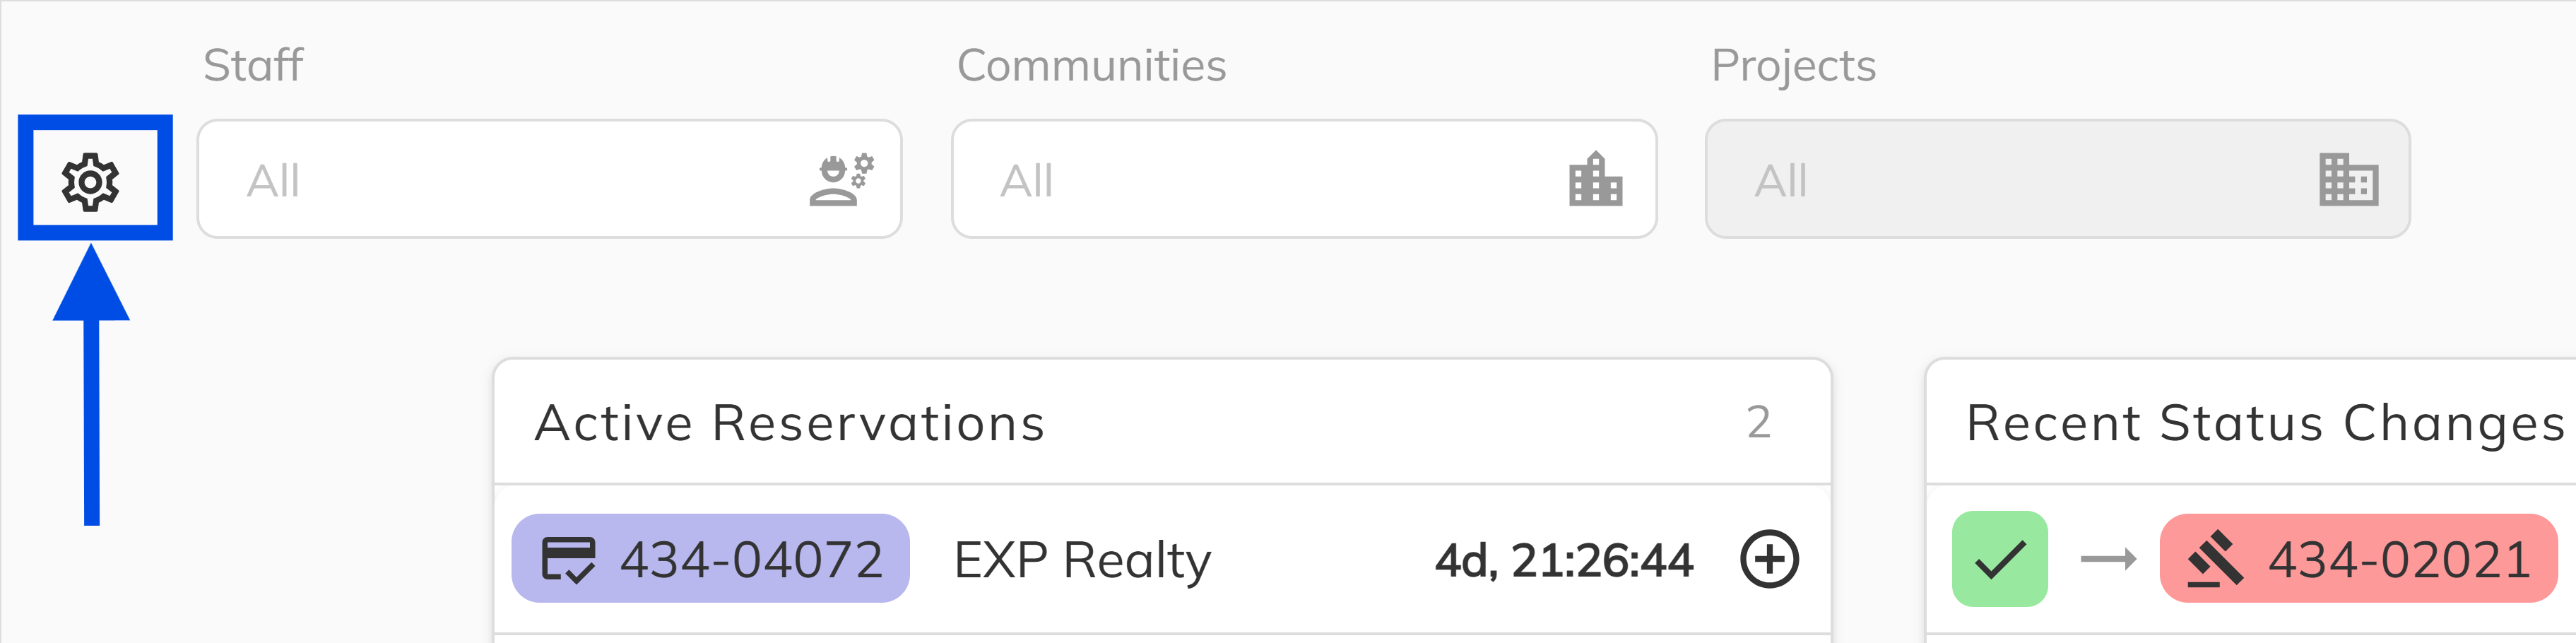
1. Open the dashboard settings
Click the Settings icon (gear) in the dashboard toolbar. A popover will appear listing all panels available to your role and permissions, along with display options.
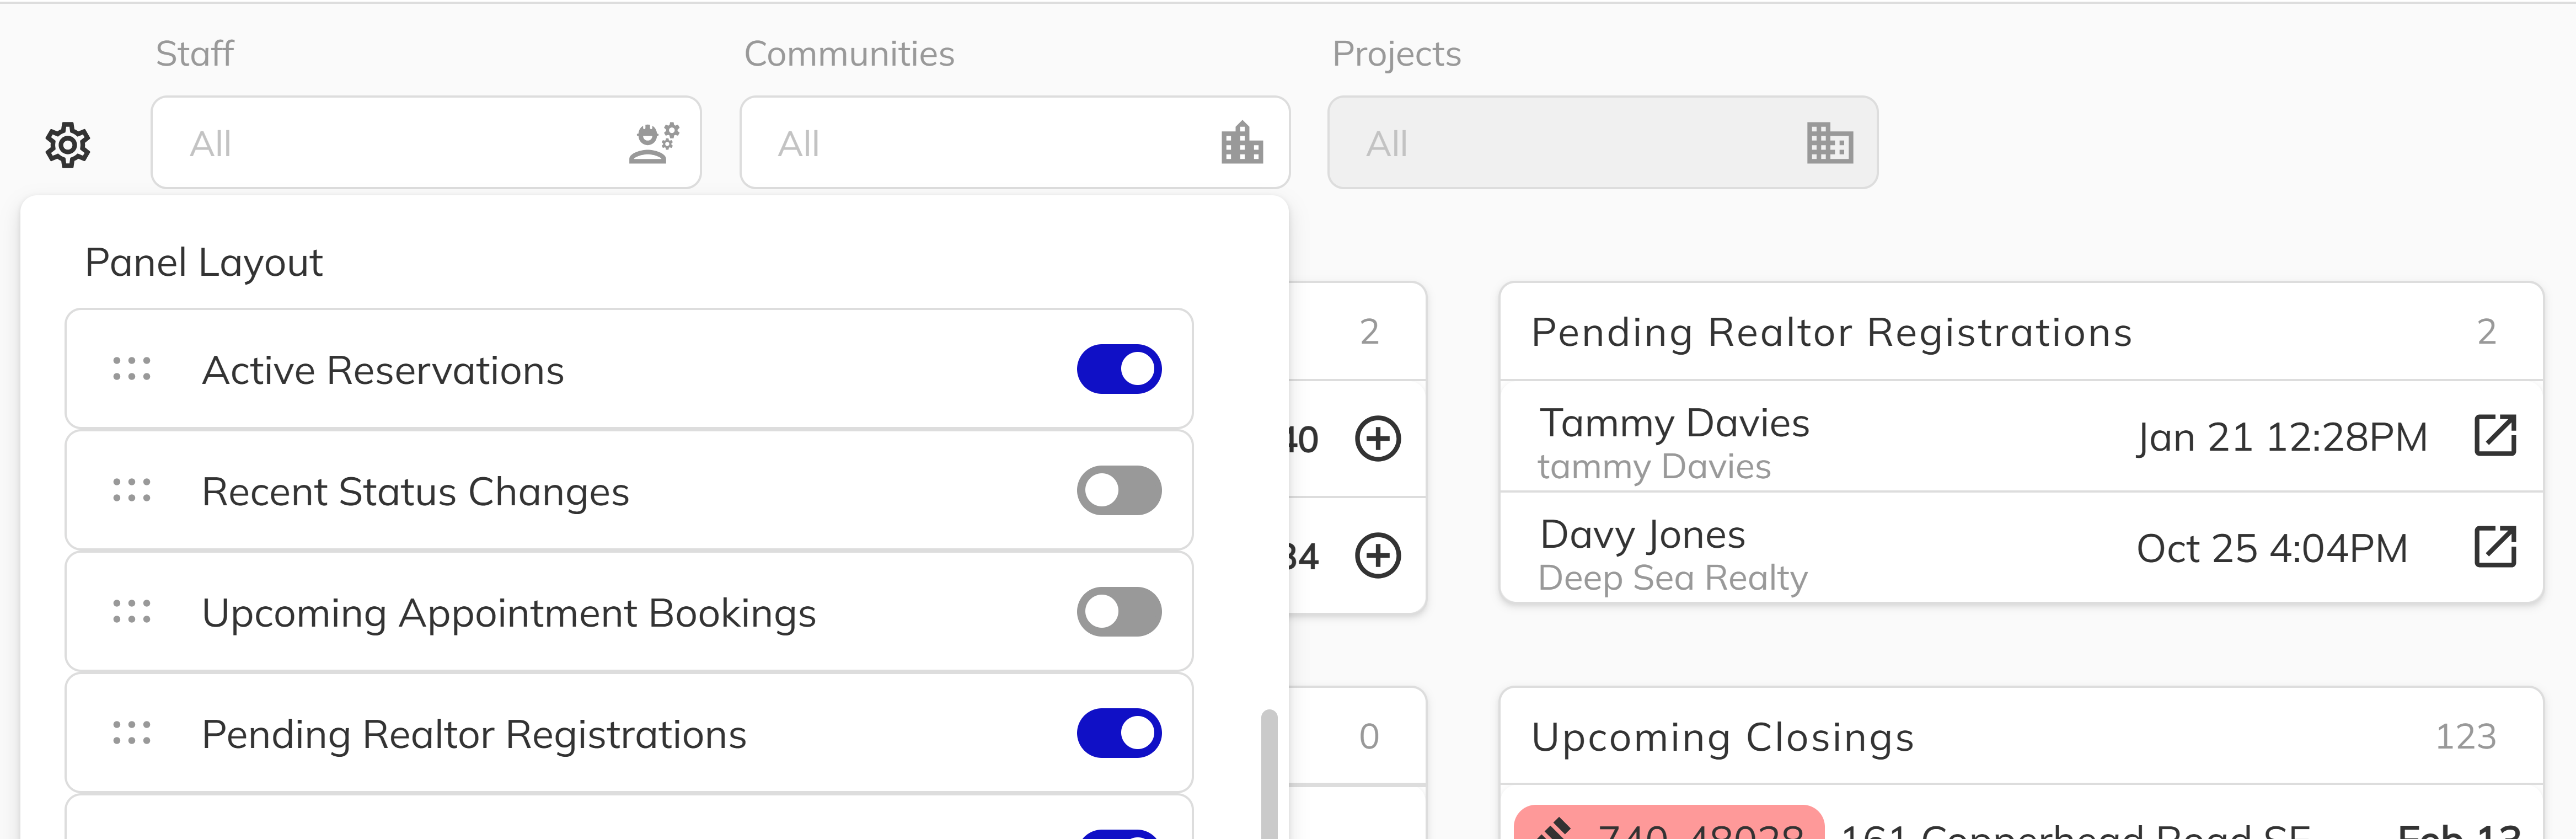
2. Toggle Dashboard panels on or off
Each panel type has a Switch toggle next to it. Turn a switch off to hide that panel from your dashboard, or on to show it. Only panels available to your permissions are listed — you won't see options for panels you don't have access to.
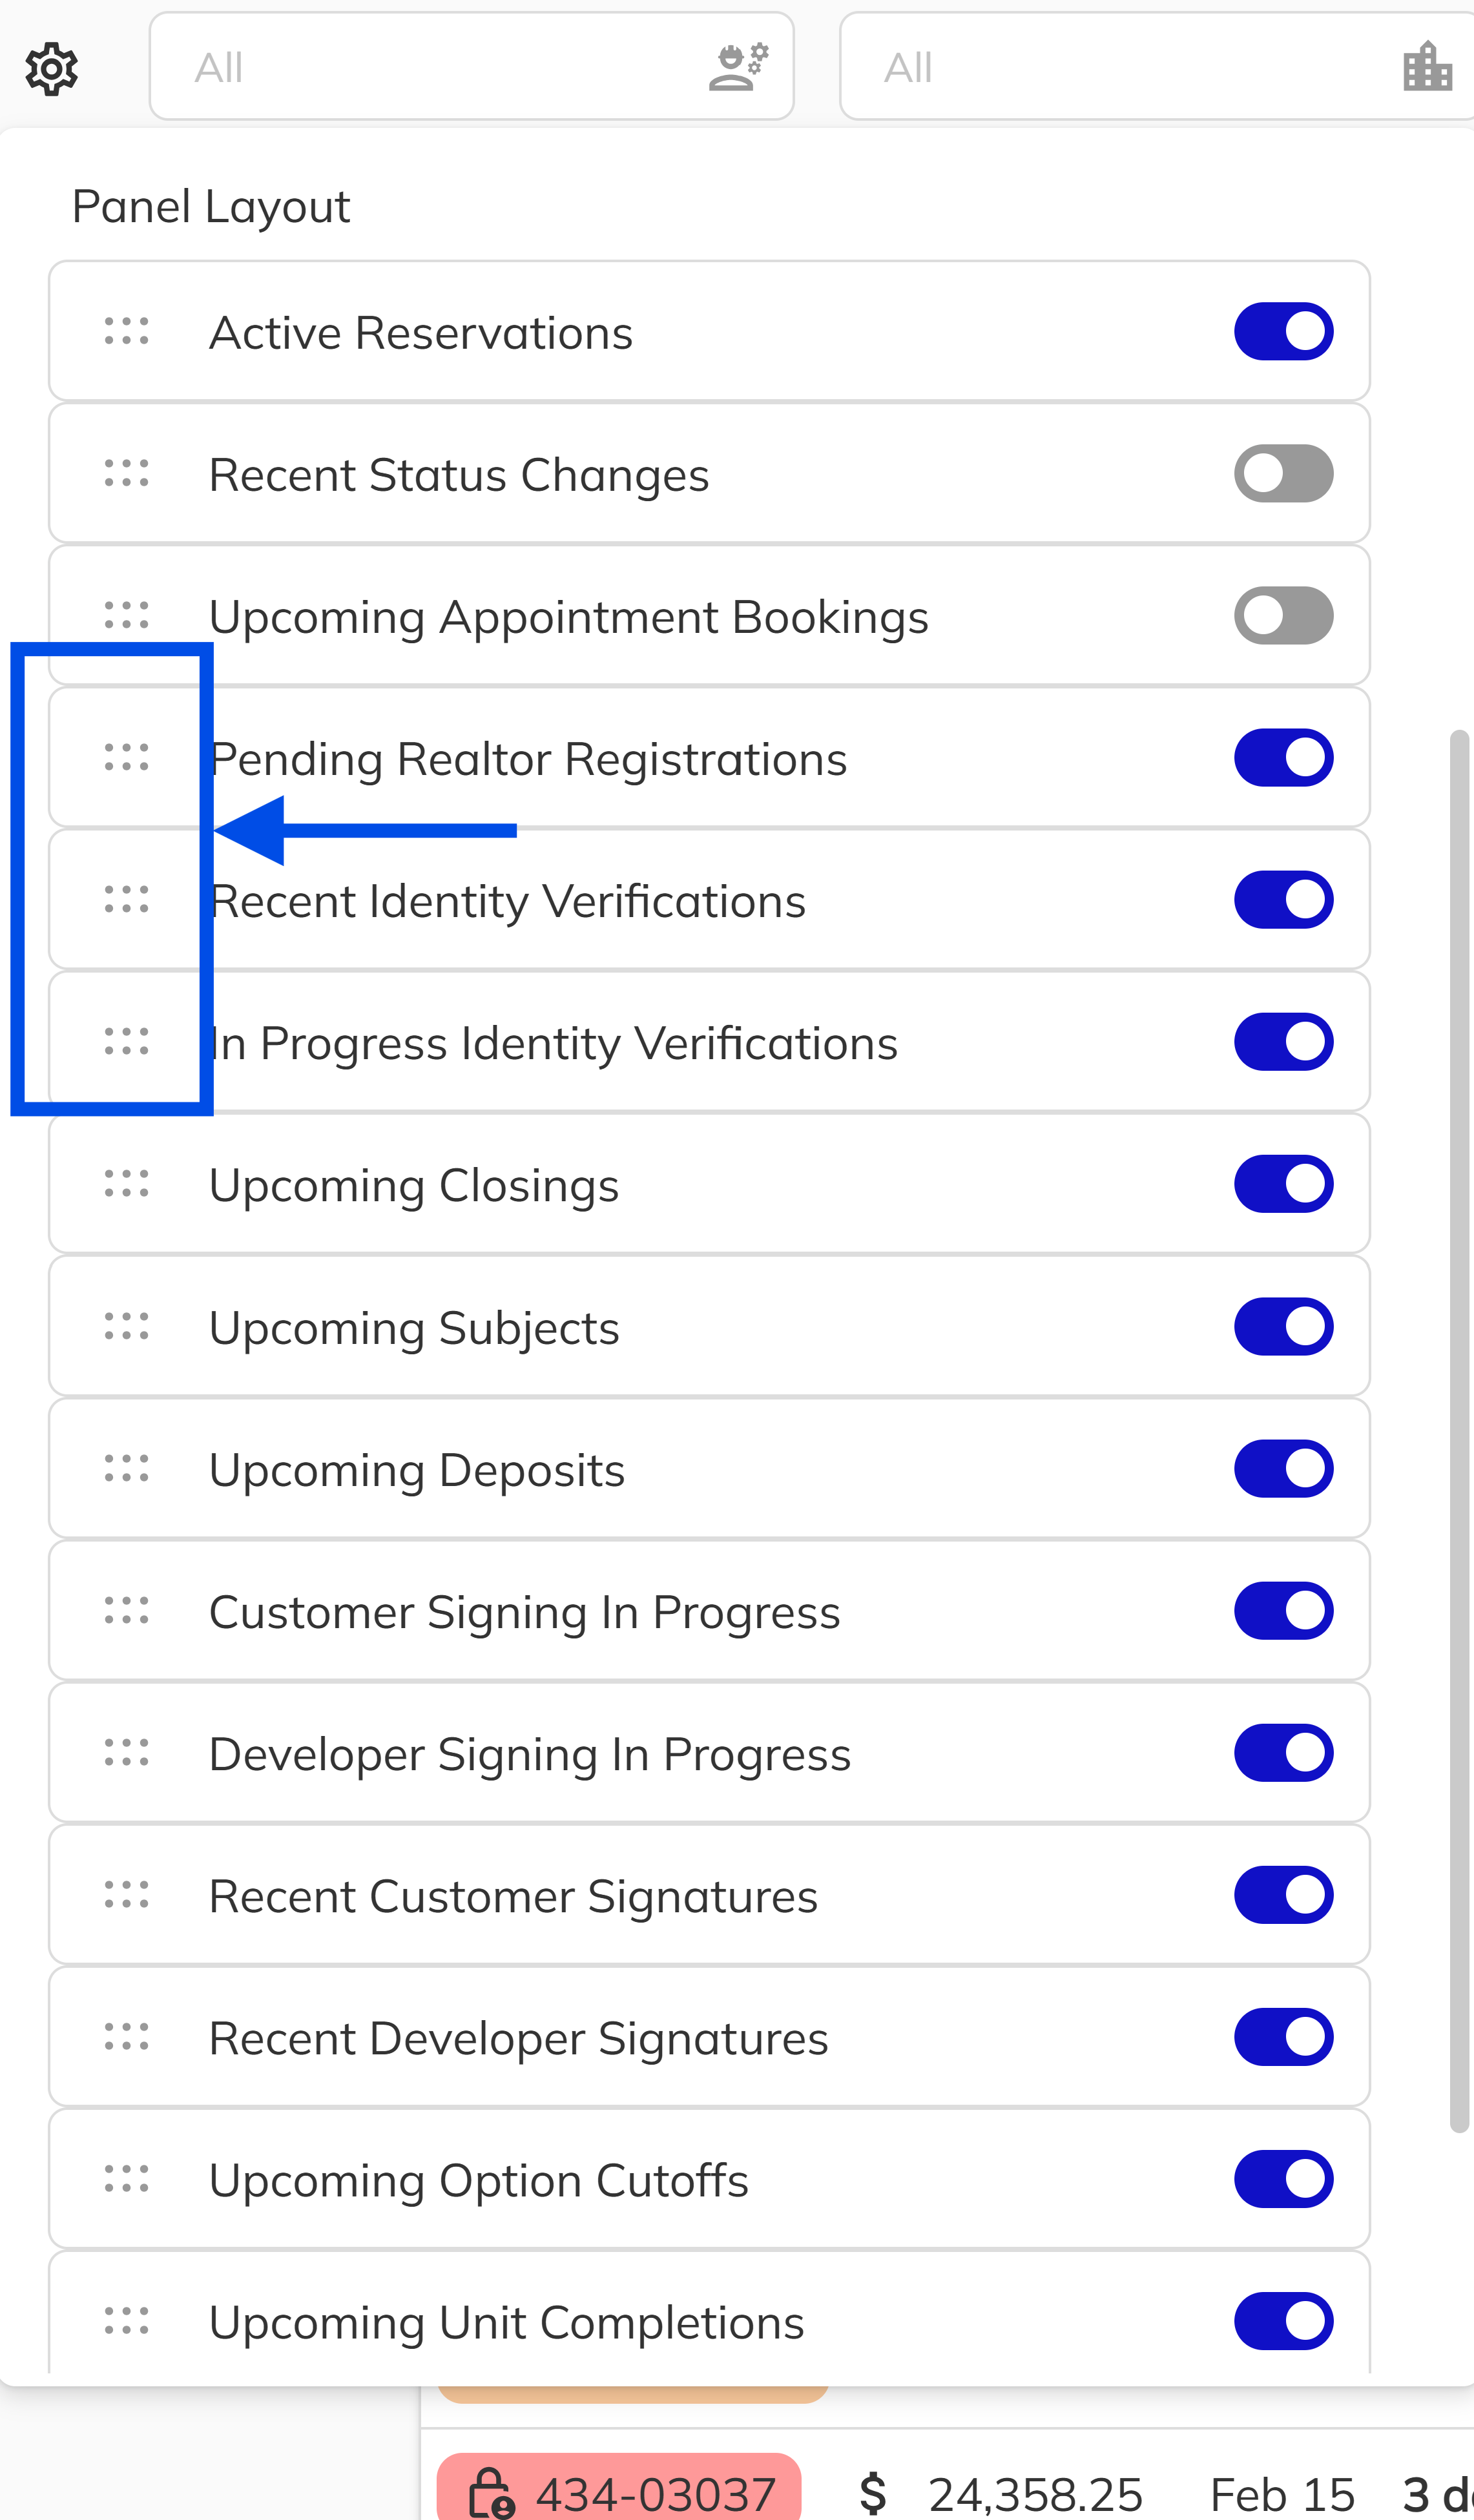
Reordering Panels with Drag and Drop
1. Drag panels into your preferred order
In the settings popover, each panel row has a drag handle icon on the left side. Click and hold the drag handle, then move the panel up or down in the list to rearrange the display order. Release to drop the panel into its new position. The dashboard will immediately reflect your new layout.
Adjusting Display Settings
1. Configure how data appears in panels
Within the settings popover, you can fine-tune how information is displayed across all panels:
- Items per Panel — Set the number of rows shown in each panel before a "Show all" link appears. The default is 8.
- Unit Display Mode — Choose how units are identified across the dashboard:
- Unit Number — e.g. "J-1234"
- Address & Unit — e.g. "321 Main St #123"
- Address, Unit & Strata — e.g. "321 Main St #123 (13)"
- Address Only — e.g. "321 Main St"
- Lot & Address — e.g. "#6, 321 Main St"
- Show Unit Status Icons — Toggle to display or hide sales status icons next to unit identifiers in each panel.
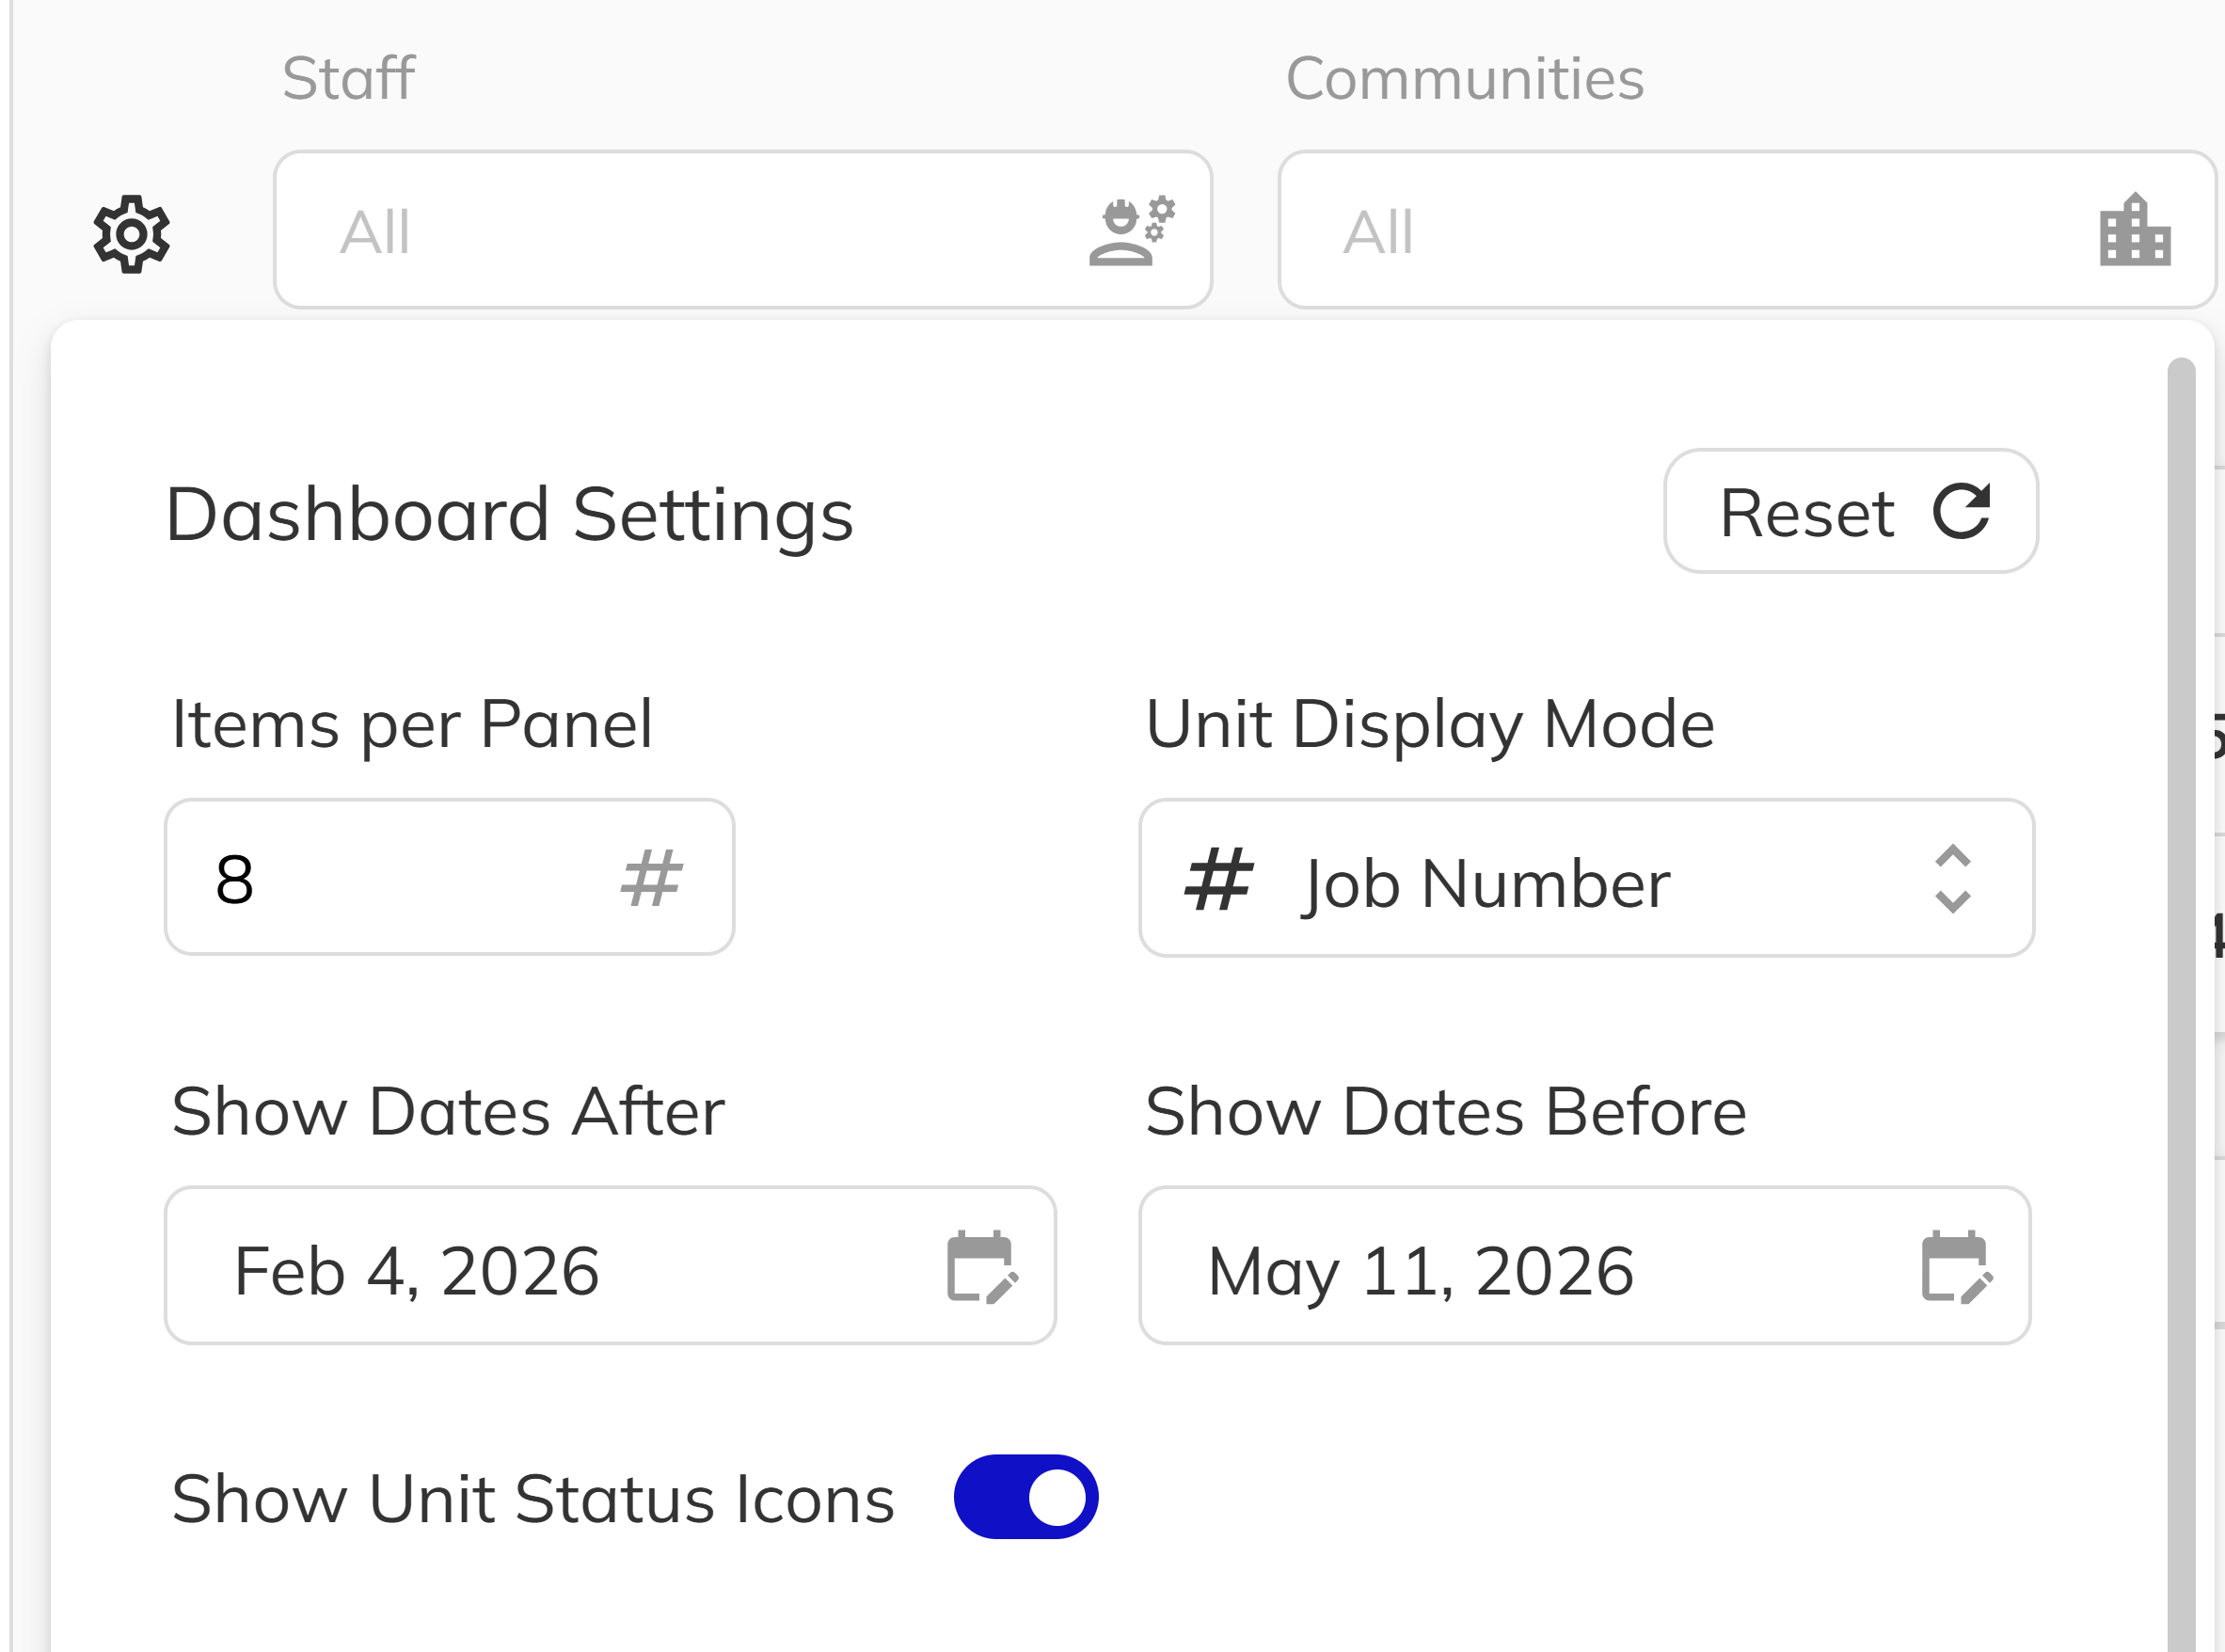
If you want to start fresh, click the Reset button at the bottom of the settings popover. This will restore all panel visibility, ordering, and display settings to their defaults.
Filtering Your Dashboard
1. Filter by communities and projects
Use the Communities and Projects filter dropdowns in the dashboard toolbar to narrow the data shown across all panels. Select one or more communities to see only the data for those communities. Once a community is selected, the Projects filter becomes available, allowing you to drill down further into specific projects within those communities.
2. Filter by staff member
If you have the View Other Staff Dashboards permission, a Staff filter will appear in the toolbar. This multi-select dropdown lets you choose one or more staff members to view their dashboard data alongside or instead of your own. If you don't have this permission, the staff filter will not be visible and the dashboard will only display your own activity.
3. Set the activity date range
The Show Dates After and Show Dates Before date pickers control the time window for dashboard activity. By default, the dashboard shows activity from the past 7 days through 3 months into the future. Adjust these dates to focus on a specific period, such as upcoming weeks or historical activity.
4. Refresh the dashboard data
Click the Refresh button in the toolbar to manually pull the latest data from the server. The dashboard also refreshes automatically when you navigate back to it or change your division or date range settings.
Your Dashboard Remembers You
One of the most practical features of the dashboard is that your customizations are saved to your device automatically. The next time you log into the sales app on the same device, your dashboard will look exactly the way you left it — same panel order, same visibility settings, same filters, and same display preferences.
This includes:
- Which panels are visible and their order
- Items per panel count
- Unit display mode
- Status icon visibility
- Selected community, project, and staff filters
These settings are stored locally on your device, so they persist across sessions without any manual saving. If you switch to a different device, you'll start with the default layout and can customize it again for that device.
Dashboard preferences are saved per device. If you use multiple computers or browsers, each one maintains its own dashboard configuration independently.
Congratulations! You now know how to fully customize your dashboard experience — from toggling and reordering panels, to applying filters and adjusting display settings. Your personalized layout will be waiting for you every time you return, making the dashboard a tool that adapts to how you work.